Nowadays Jenkins has beenused in many companies to automate their build tasks and Elasticsearch to storedocumented data to visualization the data via Kibana.
Hello there, in my lastarticle, I have explained about ELK Stack and Why we monitor the InfrastructureLogs, Application Logs, etc.
In this blog, I willexplain how to Analyze Jenkins Build Logs on your Kibana Dashboard. So, as wealready know Jenkins is an automation server (tool). Whenever it comes tomonitoring the system, “Analysis of Jenkins Logs” are important because lots ofcompanies are using it as Automation tool.
That’s why in this blog, we will learn how we can fetch the Jenkins Build Logs to our ELK Serverand visualize it on Kibana Dashboard.
STEP 1: -
1. Setup Jenkins are ELK server on VMs (VirtualMachine are preferable) by doing Installation.1. Jenkins and 2. ELK
STEP 2: -
1. Install Logstash Plugin inJenkins
2. Login to Jenkins > Manage Jenkins > PluginManager > “Click Available Tab” > search “Logstash” in filter box, theninstall it.
STEP 3: -
Create Index inElasticsearch, Jenkins send the build job logs to this Elasticsearch Index. Usethis command:
curl -X PUT “Elasticsearch_IP:9200/Index_name?pretty”
eg :
curl -X PUT “192.168.56.136:9200/logstash?pretty”
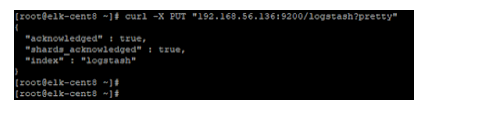
New Index in Elasticsearch
STEP 4: -
Configure Logstash plugin inJenkins,
Login to Jenkins > Manage Jenkins > Configure System > find “Logstash”and do the following,
1. enable “Enable sending logs to an Indexer”
2. Indexer Type : Elastic Search
If you have username and password, fill it and save the configuration.

STEP5: -
Create and Configure JenkinsJobs to send build jobs to Elasticsearch,
1. Create a Job,
Login to Jenkins > New Item > Enter Job name > Choose the project type(I used Freestyle project)
2. Go to Build Environment part, click “Add build step” > choose “ExecuteShell” > give any basic shell command. (Eg: free -m)
3. Configure Job to send logs to Elasticsearch,
4. In the same job, go to Post-build Actions > Choose “Send Console log toLogstash” Save it.
Now click “Build now” and check the logs in Elasticsearch by Chrome browserplugin “Elasticsearch Head”
example data,
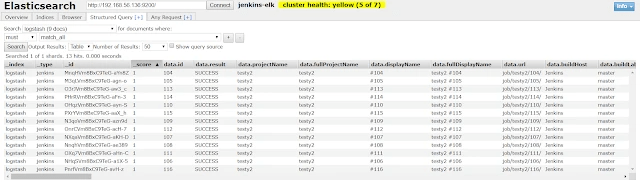
ElasticSearch Index Data
STEP 6: -
Add Index Pattern in Kibanato Analyze the logs,
Login to Kibana console > Management >Index Patterns > Create Index Patterns, here we can see the ElasticsearchIndex then create it.
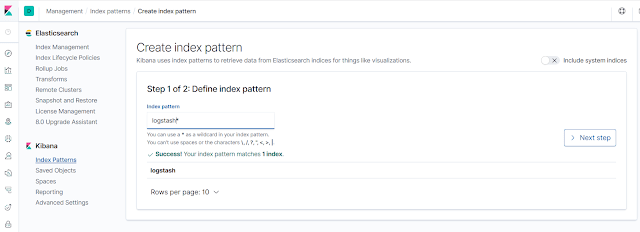
Kibana Dashboard — Create index Pattern
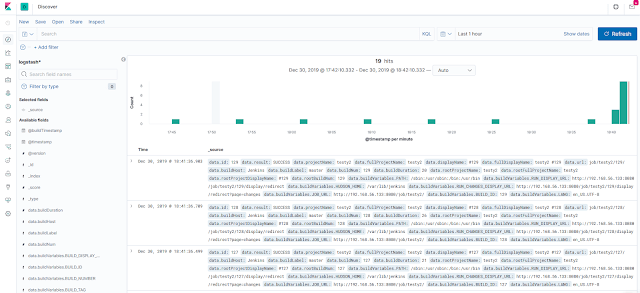
Real Time Jenkins Build Logs on to Kibana Dashboard
That’s all, successfully exported Jenkins build jobsto Elasticsearch and visualized by Kibana to analyse the Build logs.